|
|
|
Community and Economic Development – Blog by UNC School of Government https://ced.sog.unc.edu New Tool Helps Communities Assess the Affordability of ServicesBy Glenn BarnesPublished September 23, 2014When the five small water systems in Hampton County, South Carolina decided to band together to create the Lowcountry Regional Water System (LRWS), they, like many other small water systems across the country, faced a number of managerial and financial obstacles. Among these challenges were a flat growth rate, degraded and inadequate infrastructure, artificially low rates, and an economically disadvantaged population. Each of the five communities in this rural county charged vastly different amounts for their service, with monthly rates for 5,000 gallons of water and sewer ranging from as low as $36.50 to as high as $62.67. Whether the rates of the new, regionalized water system were “affordable” for all customers became a top concern for the LRWS. The Lowcountry Regional Water System is not alone. Increasingly, many communities are concerned about whether the services they offer their citizens are affordable, including water and wastewater service. One way to measure the affordability of a service, and the most common way for water and wastewater systems, is “Percent MHI”—that is, the percentage of the monthly or annual income the median household within a community would spend for a particular service. But there are known problems with using Percent MHI as the only indicator of affordability. It’s better to assess affordability using a range metrics, not just one, in order to get a more comprehensive view of affordability for different groups within a community. The Census Bureau’s American Community Survey offers other data that can help us have a more complete picture of affordability. In addition to reporting the MHI, the American Community Survey has information on Income and Benefits at various income “buckets”—under $10,000, $10,000 to $14,999, $15,000 to $19,999, and so on. It also shows the percentage of households that are enrolled in social safety net programs like Supplemental Security Income and food stamps.
The EFC’s new easy-to-use Excel tool assesses affordability for the average citizen, low-income citizen, and a full range of households based on their various income levels. The tool also allows a community to compare service charges side-by-side. Multiple indicators of affordability are built into this model to create a more comprehensive assessment of affordability in addition to Percent MHI. Data input should take just a few minutes. Users enter the typical service fee and then copy and paste select data from the census tables. The tool then does the calculations automatically and shows the results in charts and graphs. Ultimately, as was the case in Hampton County, it is up to individual communities to decide if their services are affordable. This tool will help communities make more informed decisions.
|
Published September 23, 2014 By Glenn Barnes
When the five small water systems in Hampton County, South Carolina decided to band together to create the Lowcountry Regional Water System (LRWS), they, like many other small water systems across the country, faced a number of managerial and financial obstacles. Among these challenges were a flat growth rate, degraded and inadequate infrastructure, artificially low rates, and an economically disadvantaged population. Each of the five communities in this rural county charged vastly different amounts for their service, with monthly rates for 5,000 gallons of water and sewer ranging from as low as $36.50 to as high as $62.67. Whether the rates of the new, regionalized water system were “affordable” for all customers became a top concern for the LRWS.
The Lowcountry Regional Water System is not alone. Increasingly, many communities are concerned about whether the services they offer their citizens are affordable, including water and wastewater service. One way to measure the affordability of a service, and the most common way for water and wastewater systems, is “Percent MHI”—that is, the percentage of the monthly or annual income the median household within a community would spend for a particular service.
But there are known problems with using Percent MHI as the only indicator of affordability. It’s better to assess affordability using a range metrics, not just one, in order to get a more comprehensive view of affordability for different groups within a community.
The Census Bureau’s American Community Survey offers other data that can help us have a more complete picture of affordability. In addition to reporting the MHI, the American Community Survey has information on Income and Benefits at various income “buckets”—under $10,000, $10,000 to $14,999, $15,000 to $19,999, and so on. It also shows the percentage of households that are enrolled in social safety net programs like Supplemental Security Income and food stamps.
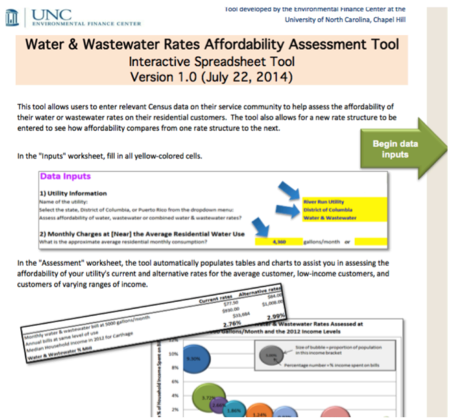 The Environmental Finance Center at UNC has developed a new tool designed to help communities determine the affordability of their services. The Excel-based Water and Wastewater Residential Rates Affordability Assessment Tool is now available for free. While the tool was developed specifically for water and wastewater systems, the premise behind it can be used to determine the affordability of any government or community service.
The EFC’s new easy-to-use Excel tool assesses affordability for the average citizen, low-income citizen, and a full range of households based on their various income levels. The tool also allows a community to compare service charges side-by-side. Multiple indicators of affordability are built into this model to create a more comprehensive assessment of affordability in addition to Percent MHI.
Data input should take just a few minutes. Users enter the typical service fee and then copy and paste select data from the census tables. The tool then does the calculations automatically and shows the results in charts and graphs.
Ultimately, as was the case in Hampton County, it is up to individual communities to decide if their services are affordable. This tool will help communities make more informed decisions.
Author(s)
Tagged Under
This blog post is published and posted online by the School of Government to address issues of interest to government officials. This blog post is for educational and informational Copyright ©️ 2009 to present School of Government at the University of North Carolina. All rights reserved. use and may be used for those purposes without permission by providing acknowledgment of its source. Use of this blog post for commercial purposes is prohibited. To browse a complete catalog of School of Government publications, please visit the School’s website at www.sog.unc.edu or contact the Bookstore, School of Government, CB# 3330 Knapp-Sanders Building, UNC Chapel Hill, Chapel Hill, NC 27599-3330; e-mail sales@sog.unc.edu; telephone 919.966.4119; or fax 919.962.2707.