
|
|
|
Community and Economic Development – Blog by UNC School of Government https://ced.sog.unc.edu Key Financial Indicators: Debt Service Coverage RatioBy Glenn BarnesPublished June 23, 2015In previous posts, we have discussed where to find data to help make smart financial and managerial decisions. Another vital data source for any enterprise is its own financial statements, from which enterprises can calculate key financial indicators. In March, we discussed operating ratio. This post will discuss another key financial indicator–debt service coverage ratio. Debt service coverage ratio is an important indicator for many aspects of community and economic development. For this blog, let’s look at key financial indicators from the perspective of a business-like unit within government–a water or wastewater system. Key financial indicators are a way for that enterprise to get a snapshot of its financial health and to determine whether it needs to make adjustments to its rates, and they should be calculated annually when financial statements are released. Debt service coverage ratio, as the name suggests, measures the system’s ability to pay its long-term debts. Debt service coverage ratio is calculated by dividing annual net operating revenues (calculated by subtracting total operating expenses excluding depreciation from total operating revenues) by the system’s annual principal and interest payments on all long-term debt. If the system is owned by a government that follows GASB 34 procedures for audited financial statements, the operating revenue and operating expense numbers can be found on the Statement of Revenues, Expenses, and Changes in Fund Net Assets for the proprietary fund, and the principal and interest on long-term debt can be found on the Statement of Cash Flows. A debt service coverage ratio of 1.0 means that the system has exactly enough money from its operating revenues to pay off its annual debt service once it has paid all of its operating expenses. But lenders like a little extra security in case revenues unexpectedly go down or costs go up. In fact, most bond covenants or loan term agreements specify exactly what this ratio needs to be every year, and the target is often 1.2 or higher, meaning that the lenders requires the utility to have enough revenues coming in to pay O&M costs and debt service and still have a buffer and security for potentially lean years. Often, systems exceed these targets. The median debt service coverage ratio for a water and wastewater system with a AAA bond rating from Fitch Ratings in 2015 was 2.8. That means that half of those systems with the highest possible bond rating, after paying for their operations and maintenance, had enough revenues left over to pay for 280 percent of their debt service. That is, of course, very high. More systems are A-rated, and the median debt service coverage ratio for those systems in 2015 was 2.0. In our workshops on rate setting and fiscal planning for small water systems, we often include a session on how to measure key financial indicators like debt service coverage ratio by showing two example water systems—Bavaria and Mayberry. These are two similarly sized water systems from the same state (the names have been changed, but the numbers are real). Each serves about 1,500 customers, and each community has a median household income of about $30,000 with about 25 percent of residents living below the poverty line. On paper, these two systems look identical, but their debt service coverage ratios tell a very different story. In our example, Bavaria has annual operating revenues of about $710,000, with operating expenses (excluding depreciation) of about $460,000. Bavaria’s annual principal and interest payments are just over $190,000, giving it a debt service coverage ratio of 1.32. In Mayberry, the annual operating revenue is about $444,000, with annual operating expenses (without depreciation) of approximately $369,000. Mayberry’s annual principal and interest payments total just under $85,000, giving it a debt service coverage ratio of 0.89.
Bavaria not only exceeds the minimum threshold of 1.0, but they also exceed the 1.2 level that many lenders require. That means that they have enough money coming in through operating revenues to pay operating expenses, pay debt service, and still have some left over for capital reserves, emergencies, or other needs. Nevertheless, their ratio is still far below the Fitch median for A-rated systems. Mayberry, however, is a different story. Their debt service coverage ratio fails to reach 1.0, meaning that they do not bring in enough funding through their operating revenues to cover the annual cost of system operations and debt service. Does that mean that Mayberry is defaulting on its debt? Absolutely not. Most likely, they are covering their debt service either out of the system’s reserve funds or possibly, since they are a local government, out of the general fund. Since in our previous post we saw that Mayberry failed to reach targets for operating ratio as well, this may be an indication that the system’s rates are too low. Certainly, very few if any lenders would be willing to loan money to the system until their debt service coverage ratio improves. Even Bavaria may want to consider a rate increase based on these numbers. While they are meeting minimum standards, they are still well below the median for many of their peers. Taken together, operating ratio and debt service coverage ratio provide the broadest perspectives of financial self-sufficiency and financial performance for water systems. Calculating these and other ratios can be the first step in an annual review of the adequacy of water and wastewater rates. |
Published June 23, 2015 By Glenn Barnes
In previous posts, we have discussed where to find data to help make smart financial and managerial decisions. Another vital data source for any enterprise is its own financial statements, from which enterprises can calculate key financial indicators. In March, we discussed operating ratio. This post will discuss another key financial indicator–debt service coverage ratio.
Debt service coverage ratio is an important indicator for many aspects of community and economic development. For this blog, let’s look at key financial indicators from the perspective of a business-like unit within government–a water or wastewater system. Key financial indicators are a way for that enterprise to get a snapshot of its financial health and to determine whether it needs to make adjustments to its rates, and they should be calculated annually when financial statements are released. Debt service coverage ratio, as the name suggests, measures the system’s ability to pay its long-term debts.
Debt service coverage ratio is calculated by dividing annual net operating revenues (calculated by subtracting total operating expenses excluding depreciation from total operating revenues) by the system’s annual principal and interest payments on all long-term debt. If the system is owned by a government that follows GASB 34 procedures for audited financial statements, the operating revenue and operating expense numbers can be found on the Statement of Revenues, Expenses, and Changes in Fund Net Assets for the proprietary fund, and the principal and interest on long-term debt can be found on the Statement of Cash Flows.
A debt service coverage ratio of 1.0 means that the system has exactly enough money from its operating revenues to pay off its annual debt service once it has paid all of its operating expenses. But lenders like a little extra security in case revenues unexpectedly go down or costs go up. In fact, most bond covenants or loan term agreements specify exactly what this ratio needs to be every year, and the target is often 1.2 or higher, meaning that the lenders requires the utility to have enough revenues coming in to pay O&M costs and debt service and still have a buffer and security for potentially lean years.
Often, systems exceed these targets. The median debt service coverage ratio for a water and wastewater system with a AAA bond rating from Fitch Ratings in 2015 was 2.8. That means that half of those systems with the highest possible bond rating, after paying for their operations and maintenance, had enough revenues left over to pay for 280 percent of their debt service. That is, of course, very high. More systems are A-rated, and the median debt service coverage ratio for those systems in 2015 was 2.0.
In our workshops on rate setting and fiscal planning for small water systems, we often include a session on how to measure key financial indicators like debt service coverage ratio by showing two example water systems—Bavaria and Mayberry. These are two similarly sized water systems from the same state (the names have been changed, but the numbers are real). Each serves about 1,500 customers, and each community has a median household income of about $30,000 with about 25 percent of residents living below the poverty line. On paper, these two systems look identical, but their debt service coverage ratios tell a very different story.
In our example, Bavaria has annual operating revenues of about $710,000, with operating expenses (excluding depreciation) of about $460,000. Bavaria’s annual principal and interest payments are just over $190,000, giving it a debt service coverage ratio of 1.32.
In Mayberry, the annual operating revenue is about $444,000, with annual operating expenses (without depreciation) of approximately $369,000. Mayberry’s annual principal and interest payments total just under $85,000, giving it a debt service coverage ratio of 0.89.
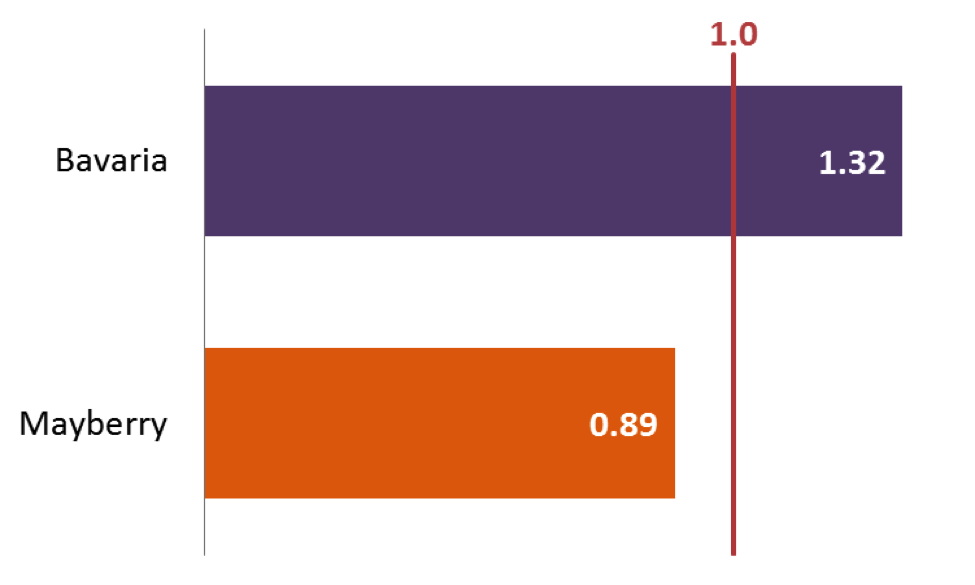
Bavaria not only exceeds the minimum threshold of 1.0, but they also exceed the 1.2 level that many lenders require. That means that they have enough money coming in through operating revenues to pay operating expenses, pay debt service, and still have some left over for capital reserves, emergencies, or other needs. Nevertheless, their ratio is still far below the Fitch median for A-rated systems.
Mayberry, however, is a different story. Their debt service coverage ratio fails to reach 1.0, meaning that they do not bring in enough funding through their operating revenues to cover the annual cost of system operations and debt service. Does that mean that Mayberry is defaulting on its debt? Absolutely not. Most likely, they are covering their debt service either out of the system’s reserve funds or possibly, since they are a local government, out of the general fund.
Since in our previous post we saw that Mayberry failed to reach targets for operating ratio as well, this may be an indication that the system’s rates are too low. Certainly, very few if any lenders would be willing to loan money to the system until their debt service coverage ratio improves. Even Bavaria may want to consider a rate increase based on these numbers. While they are meeting minimum standards, they are still well below the median for many of their peers.
Taken together, operating ratio and debt service coverage ratio provide the broadest perspectives of financial self-sufficiency and financial performance for water systems. Calculating these and other ratios can be the first step in an annual review of the adequacy of water and wastewater rates.
Author(s)
Tagged Under
This blog post is published and posted online by the School of Government to address issues of interest to government officials. This blog post is for educational and informational Copyright ©️ 2009 to present School of Government at the University of North Carolina. All rights reserved. use and may be used for those purposes without permission by providing acknowledgment of its source. Use of this blog post for commercial purposes is prohibited. To browse a complete catalog of School of Government publications, please visit the School’s website at www.sog.unc.edu or contact the Bookstore, School of Government, CB# 3330 Knapp-Sanders Building, UNC Chapel Hill, Chapel Hill, NC 27599-3330; e-mail sales@sog.unc.edu; telephone 919.966.4119; or fax 919.962.2707.