
|
| ||||||||||||||||||||
|
Community and Economic Development – Blog by UNC School of Government https://ced.sog.unc.edu Utility Finance: Are all your eggs in one basket?By CED Guest AuthorPublished August 28, 2012Economic development and large commercial customers contribute greatly to the financial success and stability of utility operations, but an over-dependence on these customers can put a utility’s revenue at risk. The table below compares non-residential water customer summary statistics from the Town of Benson, and the Cities of Raleigh and High Point. The comparison shows the % of water sales collected from non-residential customers disproportionate to customer composition for each utility. But beyond that, the difference among the Piedmont cohort is stark. In 2010, the Town of Benson delivered a significant amount of their supply and collected a significant amount of revenue from only 22% of its customer base. A change in the demand from this small amount (n=464) of customers could put a great deal of the Town’s water utility revenues at risk.
A closer look at these non-residential customers presents an even scarier outlook. The term “non-residential” defines what a customer is not, and not what a customer is. A “non-residential” customer, as categorized above, could be anything from a small insurance office in a strip mall to a brewery or a textile mill. The graph below compares the same summary statistics broken apart by the average consumption of the non-residential customers for the City of High Point. The majority (74%) of High Point non-residential customers use 10,000 gallons per month or less on average. But 2% only the non-residential customers pay 50% of the revenue collected from non-residential customers. A more striking perspective of this disparity is that 0.22% of all customers (2% of 11%) comprised 20.5% (50% of 41%) of the revenue collected from water rates and charges in 2008.
This disparity highlights why a recent review of Standard and Poor’s credit rating justifications for water utilities across the country found “Diverse Service Area” as a common characteristic of utilities with strong credit ratings. In fact, S&P assigned its AAA rating to a recent debt issuance by Raleigh’s Water and Sewer Department because (among other considerations) of the service area’s economic strength and diversity. “…. the leading 10 users represent about 12.4% and 11.8% of annual water and wastewater revenues, respectively. We consider these levels very diverse.” (Summary: Raleigh, North Carolina; Water/Sewer; July 12, 2011, Standard & Poor’s Global Credit Portal, Ratings Direct) It can, has and will take much more than a blog post to provide communities with a toolkit to mitigate against this revenue risk. But what it can do in the last 70 words is to promote, at minimum, awareness. Who are the largest contributors of utility revenue in your community and what are their future plans? In the last 10 years, many public power utilities have started “Key Accounts” programs within individual utilities that focus on large and industrial customers. Beyond providing customer service, these programs build a relationship with high profile customers to help a utility anticipate operational changes that might alter demand and revenue. Mary Tiger was formerly on staff with the UNC Environmental Finance Center. | ||||||||||||||||||||
Published August 28, 2012 By CED Guest Author
Economic development and large commercial customers contribute greatly to the financial success and stability of utility operations, but an over-dependence on these customers can put a utility’s revenue at risk.
The table below compares non-residential water customer summary statistics from the Town of Benson, and the Cities of Raleigh and High Point. The comparison shows the % of water sales collected from non-residential customers disproportionate to customer composition for each utility. But beyond that, the difference among the Piedmont cohort is stark. In 2010, the Town of Benson delivered a significant amount of their supply and collected a significant amount of revenue from only 22% of its customer base. A change in the demand from this small amount (n=464) of customers could put a great deal of the Town’s water utility revenues at risk.
| % of customers that are non-residential |
% of usage consumed by non-residential customers |
% of revenue collected from non-residential customers | |
| Benson (FY10) | 22% | 78% | 75% |
| High Point (FY08) | 11% | 50% | 41% |
| Raleigh (FY10) | 32% | 48% | 40% |
| Analysis conducted of utility billing records by the Environmental Finance Center at UNC-Chapel Hill | |||
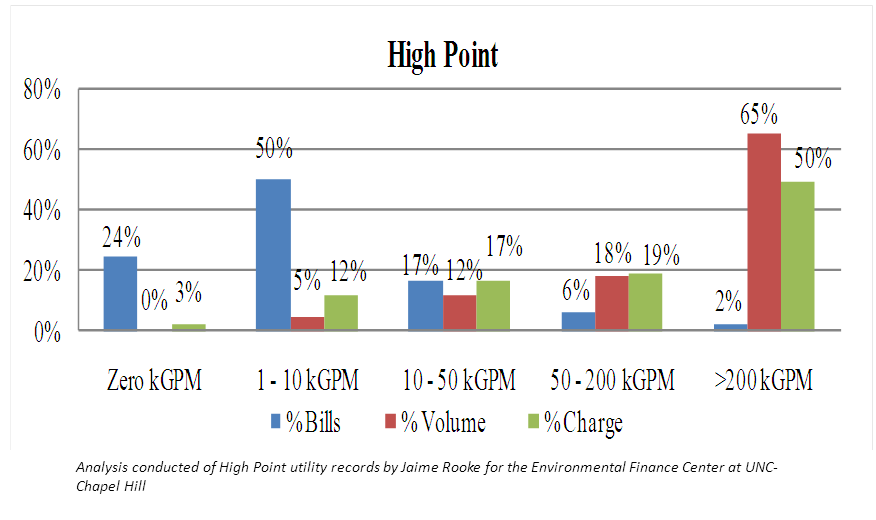
A closer look at these non-residential customers presents an even scarier outlook. The term “non-residential” defines what a customer is not, and not what a customer is. A “non-residential” customer, as categorized above, could be anything from a small insurance office in a strip mall to a brewery or a textile mill. The graph below compares the same summary statistics broken apart by the average consumption of the non-residential customers for the City of High Point. The majority (74%) of High Point non-residential customers use 10,000 gallons per month or less on average. But 2% only the non-residential customers pay 50% of the revenue collected from non-residential customers. A more striking perspective of this disparity is that 0.22% of all customers (2% of 11%) comprised 20.5% (50% of 41%) of the revenue collected from water rates and charges in 2008.
This disparity highlights why a recent review of Standard and Poor’s credit rating justifications for water utilities across the country found “Diverse Service Area” as a common characteristic of utilities with strong credit ratings. In fact, S&P assigned its AAA rating to a recent debt issuance by Raleigh’s Water and Sewer Department because (among other considerations) of the service area’s economic strength and diversity.
“…. the leading 10 users represent about 12.4% and 11.8% of annual water and wastewater revenues, respectively. We consider these levels very diverse.” (Summary: Raleigh, North Carolina; Water/Sewer; July 12, 2011, Standard & Poor’s Global Credit Portal, Ratings Direct)
It can, has and will take much more than a blog post to provide communities with a toolkit to mitigate against this revenue risk. But what it can do in the last 70 words is to promote, at minimum, awareness. Who are the largest contributors of utility revenue in your community and what are their future plans? In the last 10 years, many public power utilities have started “Key Accounts” programs within individual utilities that focus on large and industrial customers. Beyond providing customer service, these programs build a relationship with high profile customers to help a utility anticipate operational changes that might alter demand and revenue.
Mary Tiger was formerly on staff with the UNC Environmental Finance Center.
Author(s)
Tagged Under
This blog post is published and posted online by the School of Government to address issues of interest to government officials. This blog post is for educational and informational Copyright ©️ 2009 to present School of Government at the University of North Carolina. All rights reserved. use and may be used for those purposes without permission by providing acknowledgment of its source. Use of this blog post for commercial purposes is prohibited. To browse a complete catalog of School of Government publications, please visit the School’s website at www.sog.unc.edu or contact the Bookstore, School of Government, CB# 3330 Knapp-Sanders Building, UNC Chapel Hill, Chapel Hill, NC 27599-3330; e-mail sales@sog.unc.edu; telephone 919.966.4119; or fax 919.962.2707.