|
|
|
Community and Economic Development – Blog by UNC School of Government https://ced.sog.unc.edu Student Corner: Predicting Gentrification in the Era of Big DataBy CED Program Interns & StudentsPublished September 22, 2016
Social Media What do social media and gentrification have in common? Well, Desislava Hristova and other Cambridge researchers have a lot to say about that relationship. She presented a gentrification-predicting model this last April at the International World Wide Web Conference. To quote Hristova, “Data from location-based social networks may be able to predict when a neighborhood will go through the process of gentrification, by identifying areas with high social diversity and high deprivation.” These Cambridge researchers took data from Foursquare and Twitter to quantify the “social diversity” of neighborhoods in London.
That “social diversity” data was then correlated with wellbeing metrics including housing prices and crime rates. Hristova’s research is ongoing but this example illustrates how researchers are using new sources of information to predict gentrification. Permits In a Washington Post article, Emily Badger discusses how web and app-based technologies could be used to predict gentrification. What if looking up a construction project was as easy loading up an app and searching an address to pull up city and county permitting and tax data for that particular property? And imagine being able to do this for many different cities! Looking up permits and construction projects in the pipeline often ends up in downloading large and potentially messy spreadsheets. If you are on your phone, those spreadsheets are probably even more cumbersome. In response, civic tech groups have been working hard to standardize permitting applications so that permitting information is as easy to pull up as it is to find directions using Google Maps. Not only is this advantageous to the app user, but this would make reporting and data analysis much easier for researchers and for town planners. Seattle is ahead of the curve on this one and already has a mapping application identifying upcoming buildings with permitting information. They even have a spot to add a comment, all they are missing is a swipe right or left to determine public sentiment. But in all seriousness, what if we took this narrative towards a more pertinent issue, what if we could predict gentrification based on permitting data? If cities across North Carolina and the US started to standardize permitting applications that were directly funneled into an app, it could easily be a win-win for residents, researchers, and public officials in terms of data access and analysis. At that point, someone could start using permit information as a variable in a model for predicting gentrification and start comparing neighborhood by neighborhood and city by city. There are some models for standardizing permits that are currently being tested, but until there is a national permitting standard, companies like Zillow are unlikely to provide that information on their site because of the technical difficulties of parsing permitting application data accurately. Taxis and Liquor? Thought social media was an odd route for predicting social media? How about using taxi pickups and drop-offs or the number of liquor licenses issued? That is exactly what Joel Carlson at Galvanize is attempting to determine. Carlson hypothesized that the rate of taxi pickups and drop-offs and liquor licenses are correlated with changes in rental prices in New York City. After testing that hypothesis, he realized that those two variables do not add predictive power to rental prices. However, when looking at zip codes in which both variables do add predictive power to changes in rental prices, the end result is a list of zip codes that is near identical to a list of zip codes that the NYU Furman Center identified as gentrifying. Takeaway Obviously some of these methods are more applicable to larger cities with lots of data that require researchers to parse through and identify trends; however, the permitting example provides a clear path for what local governments could do to better identify gentrification. Once provided with that information, local governments can then devise and execute plans to reduce the potentially negative impacts of gentrification. Omar Kashef is a third-year graduate student seeking a dual-degree in Public Administration and Information Science and is currently a Fellow with the Development Finance Initiative. |
Published September 22, 2016 By CED Program Interns & Students
 Gentrification occurs when properties in lower-income neighborhoods are bought and renovated that subsequently raises property values but displaces low-income families. Displacement is potentially of even higher magnitude when development and construction of new housing does not meet the demand from an increase in population. In this narrative, gentrification can create additional social and economic inequities due to further displacement of a low-income population from their employment centers as well as reducing economic diversity in an area. The challenge with meeting the needs of a population that might end up being displaced is determining which populations are likely to become displaced. Once that population is determined, local governments could take measures to reduce the negative impacts of a population being displaced and potentially reduce the number of people being displaced. The key is predicting where gentrification may occur next. This blog post will identify several methods that are made possible due to the advent of Big Data.
Social Media
What do social media and gentrification have in common? Well, Desislava Hristova and other Cambridge researchers have a lot to say about that relationship. She presented a gentrification-predicting model this last April at the International World Wide Web Conference. To quote Hristova, “Data from location-based social networks may be able to predict when a neighborhood will go through the process of gentrification, by identifying areas with high social diversity and high deprivation.” These Cambridge researchers took data from Foursquare and Twitter to quantify the “social diversity” of neighborhoods in London.
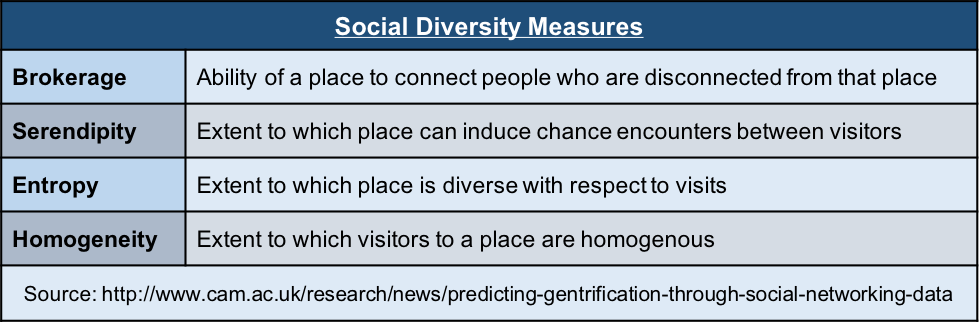
That “social diversity” data was then correlated with wellbeing metrics including housing prices and crime rates. Hristova’s research is ongoing but this example illustrates how researchers are using new sources of information to predict gentrification.
Permits
In a Washington Post article, Emily Badger discusses how web and app-based technologies could be used to predict gentrification. What if looking up a construction project was as easy loading up an app and searching an address to pull up city and county permitting and tax data for that particular property? And imagine being able to do this for many different cities! Looking up permits and construction projects in the pipeline often ends up in downloading large and potentially messy spreadsheets. If you are on your phone, those spreadsheets are probably even more cumbersome.
In response, civic tech groups have been working hard to standardize permitting applications so that permitting information is as easy to pull up as it is to find directions using Google Maps. Not only is this advantageous to the app user, but this would make reporting and data analysis much easier for researchers and for town planners. Seattle is ahead of the curve on this one and already has a mapping application identifying upcoming buildings with permitting information. They even have a spot to add a comment, all they are missing is a swipe right or left to determine public sentiment.
But in all seriousness, what if we took this narrative towards a more pertinent issue, what if we could predict gentrification based on permitting data? If cities across North Carolina and the US started to standardize permitting applications that were directly funneled into an app, it could easily be a win-win for residents, researchers, and public officials in terms of data access and analysis. At that point, someone could start using permit information as a variable in a model for predicting gentrification and start comparing neighborhood by neighborhood and city by city. There are some models for standardizing permits that are currently being tested, but until there is a national permitting standard, companies like Zillow are unlikely to provide that information on their site because of the technical difficulties of parsing permitting application data accurately.
Taxis and Liquor?
Thought social media was an odd route for predicting social media? How about using taxi pickups and drop-offs or the number of liquor licenses issued? That is exactly what Joel Carlson at Galvanize is attempting to determine. Carlson hypothesized that the rate of taxi pickups and drop-offs and liquor licenses are correlated with changes in rental prices in New York City. After testing that hypothesis, he realized that those two variables do not add predictive power to rental prices. However, when looking at zip codes in which both variables do add predictive power to changes in rental prices, the end result is a list of zip codes that is near identical to a list of zip codes that the NYU Furman Center identified as gentrifying.
Takeaway
Obviously some of these methods are more applicable to larger cities with lots of data that require researchers to parse through and identify trends; however, the permitting example provides a clear path for what local governments could do to better identify gentrification. Once provided with that information, local governments can then devise and execute plans to reduce the potentially negative impacts of gentrification.
Omar Kashef is a third-year graduate student seeking a dual-degree in Public Administration and Information Science and is currently a Fellow with the Development Finance Initiative.
Author(s)
Tagged Under
This blog post is published and posted online by the School of Government to address issues of interest to government officials. This blog post is for educational and informational Copyright ©️ 2009 to present School of Government at the University of North Carolina. All rights reserved. use and may be used for those purposes without permission by providing acknowledgment of its source. Use of this blog post for commercial purposes is prohibited. To browse a complete catalog of School of Government publications, please visit the School’s website at www.sog.unc.edu or contact the Bookstore, School of Government, CB# 3330 Knapp-Sanders Building, UNC Chapel Hill, Chapel Hill, NC 27599-3330; e-mail sales@sog.unc.edu; telephone 919.966.4119; or fax 919.962.2707.