
|
|
|
Community and Economic Development – Blog by UNC School of Government https://ced.sog.unc.edu Studying the Affordability of Water RatesBy CED Guest AuthorPublished June 27, 2017The affordability of water and wastewater rates is an issue that is attracting more attention than ever. In particular, “A Burgeoning Crisis? A Nationwide Assessment of the Geography of Water Affordability in United States”—a recent paper out of Michigan State University— has generated a great deal of debate and dialogue about the issue. The paper is worth reading for yourself, but the primary conclusion of the paper is that over the next five years, at least 35.6% of the U.S. population will have combined water and wastewater bills greater than 4.5% of their community’s median household income. One aspect of the paper that stood out to staff at the UNC Environmental Finance Center (EFC) was the numerator in that calculation—i.e. the combined bill. The authors used data from a national rate survey carried out by AWWA and Raftelis Financial to calculate an average unit cost of combined water and wastewater services ($0.01 per gallon), and then applied that cost to every geography in the country assuming that every community pays same unit cost and used 12,000 gallons per month. At the EFC, we know from our extensive research in the area that each utility prices water differently and that usage varies considerably across the country. Over the past 10 years, the EFC has built up a large database of water and wastewater rates in its state water and wastewater rates dashboards. As of June, 2017, the EFC has benchmarking dashboards for thirteen states that include 4,493 communities across the country. Over the next several months the EFC will use the data from these dashboards to look at the question of affordability at the community level from a number of different angles. EFC databases include utilities that provide only water services, only wastewater services or combined services. While the EFC doesn’t have data at this point from every state, it does have reliable community data for a significant number of communities that can shine light on affordability challenges— particularly in smaller communities which are often underrepresented in national rate surveys. In order to partially try to test some of the analyses and results from the MSU study, the EFC carried out some basic analysis of the utilities in our database that provide both water and sewer. For the purposes of this analysis, the EFC limited the data to the eight states where its data is no older than three years old (2015 onwards) and where it is in a form that is conducive to comparative analysis across state lines. These states are: Alabama, Arizona, Connecticut, Georgia, Illinois, North Carolina, Texas, and Virginia. From these states the EFC has rates data for more than 2,000 combined water and wastewater utilities. These utilities serve more than 45,000,000 people across the nine states. In addition, for most of these utilities the EFC has demographic information for their communities, such as MHI, average household size, and poverty rate. This allows us to plot water bills against a wide variety of demographics. The two charts below show a basic example of potential bi-variate analysis including a utility’s combined bill at 5,000 gallons (the most common median water use we see in most of the states we study) against the poverty rate and median household income, respectively. From these two charts alone, the importance of utility level rates data can be seen. Two utilities might have the same poverty rate, or the same median household income, but have very different bills at 5,000 gallons. The affordability questions that face these two hypothetical communities will thus be quite different. In the coming weeks and months, the EFC plans on diving further into the data to identify specific affordability trends, challenges, and potential mitigation approaches. If you’d like to learn more about this topic, please contact this post’s author using the contact information in the byline below. Daniel Irvin is the Environmental Finance Community Adviser at the Environmental Finance Center at the UNC School of Government.
|
Published June 27, 2017 By CED Guest Author
The affordability of water and wastewater rates is an issue that is attracting more attention than ever. In particular, “A Burgeoning Crisis? A Nationwide Assessment of the Geography of Water Affordability in United States”—a recent paper out of Michigan State University— has generated a great deal of debate and dialogue about the issue. The paper is worth reading for yourself, but the primary conclusion of the paper is that over the next five years, at least 35.6% of the U.S. population will have combined water and wastewater bills greater than 4.5% of their community’s median household income.
One aspect of the paper that stood out to staff at the UNC Environmental Finance Center (EFC) was the numerator in that calculation—i.e. the combined bill. The authors used data from a national rate survey carried out by AWWA and Raftelis Financial to calculate an average unit cost of combined water and wastewater services ($0.01 per gallon), and then applied that cost to every geography in the country assuming that every community pays same unit cost and used 12,000 gallons per month.
At the EFC, we know from our extensive research in the area that each utility prices water differently and that usage varies considerably across the country. Over the past 10 years, the EFC has built up a large database of water and wastewater rates in its state water and wastewater rates dashboards. As of June, 2017, the EFC has benchmarking dashboards for thirteen states that include 4,493 communities across the country. Over the next several months the EFC will use the data from these dashboards to look at the question of affordability at the community level from a number of different angles.
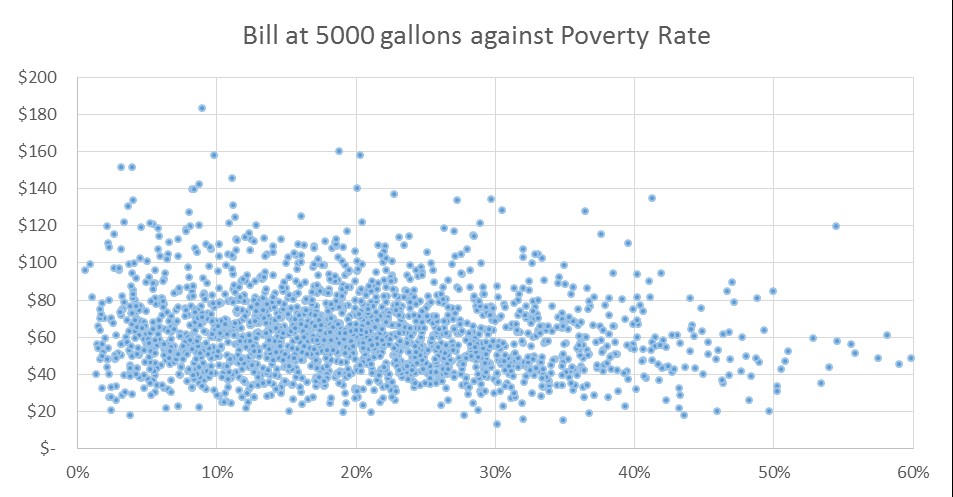
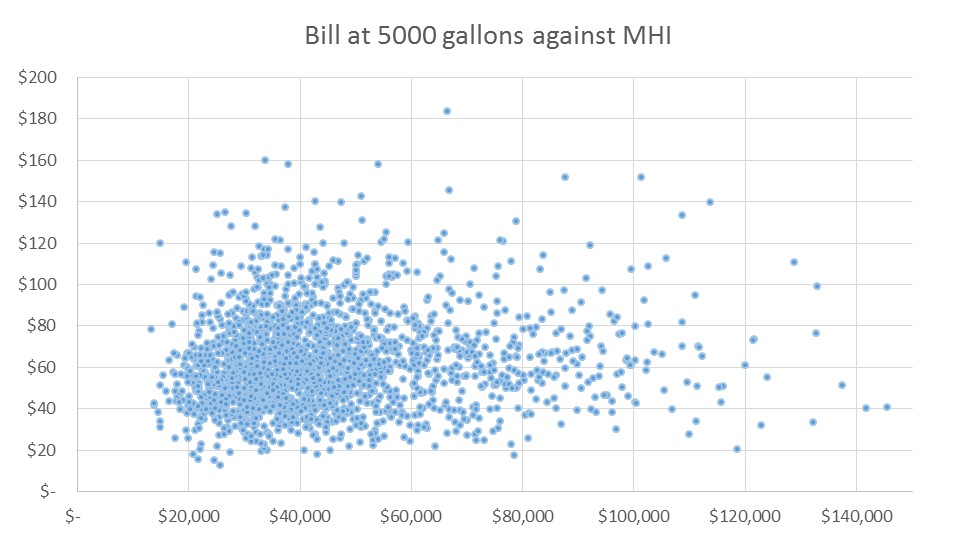
EFC databases include utilities that provide only water services, only wastewater services or combined services. While the EFC doesn’t have data at this point from every state, it does have reliable community data for a significant number of communities that can shine light on affordability challenges— particularly in smaller communities which are often underrepresented in national rate surveys. In order to partially try to test some of the analyses and results from the MSU study, the EFC carried out some basic analysis of the utilities in our database that provide both water and sewer. For the purposes of this analysis, the EFC limited the data to the eight states where its data is no older than three years old (2015 onwards) and where it is in a form that is conducive to comparative analysis across state lines. These states are: Alabama, Arizona, Connecticut, Georgia, Illinois, North Carolina, Texas, and Virginia. From these states the EFC has rates data for more than 2,000 combined water and wastewater utilities. These utilities serve more than 45,000,000 people across the nine states. In addition, for most of these utilities the EFC has demographic information for their communities, such as MHI, average household size, and poverty rate. This allows us to plot water bills against a wide variety of demographics. The two charts below show a basic example of potential bi-variate analysis including a utility’s combined bill at 5,000 gallons (the most common median water use we see in most of the states we study) against the poverty rate and median household income, respectively. From these two charts alone, the importance of utility level rates data can be seen. Two utilities might have the same poverty rate, or the same median household income, but have very different bills at 5,000 gallons. The affordability questions that face these two hypothetical communities will thus be quite different.
In the coming weeks and months, the EFC plans on diving further into the data to identify specific affordability trends, challenges, and potential mitigation approaches. If you’d like to learn more about this topic, please contact this post’s author using the contact information in the byline below.
Daniel Irvin is the Environmental Finance Community Adviser at the Environmental Finance Center at the UNC School of Government.
Author(s)
Tagged Under
This blog post is published and posted online by the School of Government to address issues of interest to government officials. This blog post is for educational and informational Copyright ©️ 2009 to present School of Government at the University of North Carolina. All rights reserved. use and may be used for those purposes without permission by providing acknowledgment of its source. Use of this blog post for commercial purposes is prohibited. To browse a complete catalog of School of Government publications, please visit the School’s website at www.sog.unc.edu or contact the Bookstore, School of Government, CB# 3330 Knapp-Sanders Building, UNC Chapel Hill, Chapel Hill, NC 27599-3330; e-mail sales@sog.unc.edu; telephone 919.966.4119; or fax 919.962.2707.