
|
|
|
Community and Economic Development – Blog by UNC School of Government https://ced.sog.unc.edu Student Corner: The Need for Place-Based Interventions in Economic DevelopmentBy CED Program Interns & StudentsPublished June 19, 2014
A Portrait of Economic Opportunity in the US and the State This research, which is based on roughly 40 million anonymous tax and social security records describing children born in the early 1980s, isolates a sample of children, reviews their parents’ earning, and classifies the children within an income quintile according to how their parents are situated in relation to all domestic earners. By comparing the income classification of children from the original sample to their earnings as adults, the researchers were able to determine their income mobility rates. By mapping these results, the researchers have revealed surprising spatial trends related to the geography of opportunity.
This map assigns colors (dark red represents low income mobility and less dark colors represent higher chances of income mobility) based on the probability of a child from the bottom income quintile climbing to the top 20% of earners. Interestingly, the southeast has the greatest concentration of low income mobility rates. The researchers took this information a step further and ranked the income mobility probability rates of the 50 largest cities. This analysis revealed a stark disparity between the income mobility rates in the highest (e.g. San Jose, CA [12.9%], San Francisco, CA [12.2%], Washington, DC [11.0%]) and lowest (e.g. Charlotte, NC [4.4%], Milwaukee, WI [4.5%], Atlanta, GA [4.5%] ranked metropolitan areas. Specifically, the odds of a poor child from San Jose moving up the income ladder are nearly three times bigger than a similarly-situated child living in Charlotte. Raleigh also appeared near the bottom of the rankings—the odds of reaching the top quintile of earners for children starting the bottom fifth was only 5%. Caveats It is important to remember that youth captured in this study often move to other places as they reach adulthood. Using this interactive map of the study results created by The New York Times, it is easier to see the variation of income mobility probability rates across the state, which range from 3.9% in the Wilson area to 8.8% out towards Andrews. Nationally, children from rural areas who achieve higher upward mobility tend to move to urban cities as adults; however, it is not clear from the maps whether the adults from North Carolina continue to reside in the state. However, the Economic Mobility of the States (2012) report by the Pew Center on the States examined the effect of geographic mobility in its report and found the incidence of individuals moving had a positive effect on individuals (those who moved out of their birth states reaped higher incomes than those who remain) and a null effect on each state’s overall income mobility rate. The report also affirmed that, overall, North Carolinians experience less economic mobility than their national peers. Implications for Community Economic Development It is no coincidence that some Native American reservations and regions with high concentrations of African-Americans also correspond with places where the odds of moving out of poverty are particularly steep. Research led by the Urban Institute and others have documented the growing disparity between what whites earn relative to blacks and Hispanics. This gap is even bigger when wealth (i.e. total assets minus total liabilities, a significant driver intergenerational mobility) is taken into account, as the white families in North Carolina have more than seven times the wealth of black households. Given that more than half of the state’s residents live in asset poverty, according to CFED’s 2014 Assets & Opportunity Scorecard, there are many avenues from which to enhance the economic mobility outcomes of residents so that disadvantaged children and families are more likely to thrive relative to their peers nationally. Conclusion Place-based interventions represent a strategic approach to dealing with the unique, spatial conditions that can undermine an individual’s attempts to attain the American Dream. Professor Chetty’s research indicates that the influence of geography and local opportunity structures (such as schools, personal networks, and the availability of community assets) offer as much (if not more) insight into a child’s economic trajectory than individual-level characteristics. For example, Professor Chetty’s keynote mentioned that white children in majority-black neighborhoods experience reduced odds of achieving upward income mobility similar to their peers in the community. Legacy outcomes related to residential racial segregation patterns are often overlooked when crafting local economic development strategies but, as the data suggests, unpacking racial and income segregation patterns may be a first step to engaging in community transformation, and, thus, increasing economic mobility rates in the state. The Z. Smith Reynolds Foundation is exploring this approach through its Community Economic Development portfolio. Are there other examples of poverty alleviation strategies in the state that explicitly address structural racism as a problem and a means to crafting solutions? Meisha McDaniel is a dual degree Master’s candidate in the Department of City and Regional Planning and the Kenan-Flagler Business School at UNC-Chapel Hill. She is also a Community Revitalization Fellow with the Development Finance Initiative. |
Published June 19, 2014 By CED Program Interns & Students
 This post reflects on the keynote presentation at this year’s “Reinventing Older Communities: Bridging Growth and Opportunity” conference hosted by the Federal Reserve Bank of Philadelphia, which was delivered by Dr. Raj Chetty, Professor of Economics at Harvard University and one of the principal investigators in The Equality of Opportunity Project. This team produced a 2013 study on intergenerational upward mobility in the United States by providing a data-driven snapshot of income mobility rates across the US, including North Carolina, where rates are amongst the lowest in the country. Their observations highlight the significance of community-level factors—levels of racial and income segregation, size of the middle class, school quality, social connectedness, and family structure— as the strongest correlates to income mobility, affecting young people before they even enter the job market. When interpreting these findings it is important to remember that the causal factors related to intergenerational economic mobility are cumulative, complex, and reflect past conditions. Crafting ‘silver-bullet’ policies based solely on these factors will not necessarily lead to higher rates of income mobility, but they can offer a framework for structuring place-based interventions. This blog post highlights some the key findings referenced here in Dr. Chetty’s lecture. The full study can be accessed here.
A Portrait of Economic Opportunity in the US and the State
This research, which is based on roughly 40 million anonymous tax and social security records describing children born in the early 1980s, isolates a sample of children, reviews their parents’ earning, and classifies the children within an income quintile according to how their parents are situated in relation to all domestic earners. By comparing the income classification of children from the original sample to their earnings as adults, the researchers were able to determine their income mobility rates. By mapping these results, the researchers have revealed surprising spatial trends related to the geography of opportunity.
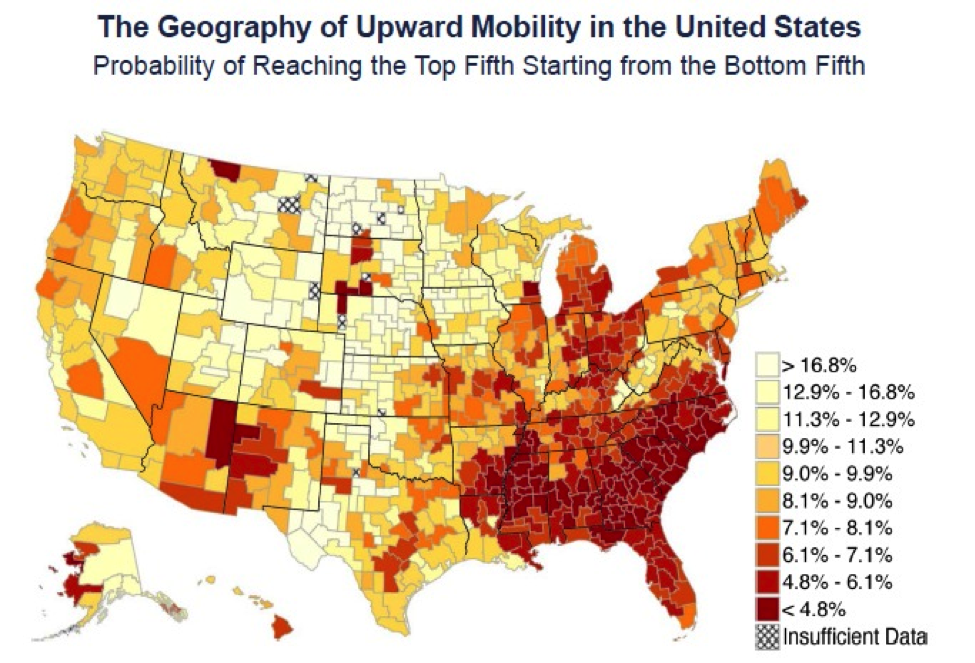
This map assigns colors (dark red represents low income mobility and less dark colors represent higher chances of income mobility) based on the probability of a child from the bottom income quintile climbing to the top 20% of earners. Interestingly, the southeast has the greatest concentration of low income mobility rates. The researchers took this information a step further and ranked the income mobility probability rates of the 50 largest cities. This analysis revealed a stark disparity between the income mobility rates in the highest (e.g. San Jose, CA [12.9%], San Francisco, CA [12.2%], Washington, DC [11.0%]) and lowest (e.g. Charlotte, NC [4.4%], Milwaukee, WI [4.5%], Atlanta, GA [4.5%] ranked metropolitan areas. Specifically, the odds of a poor child from San Jose moving up the income ladder are nearly three times bigger than a similarly-situated child living in Charlotte. Raleigh also appeared near the bottom of the rankings—the odds of reaching the top quintile of earners for children starting the bottom fifth was only 5%.
Caveats
It is important to remember that youth captured in this study often move to other places as they reach adulthood. Using this interactive map of the study results created by The New York Times, it is easier to see the variation of income mobility probability rates across the state, which range from 3.9% in the Wilson area to 8.8% out towards Andrews. Nationally, children from rural areas who achieve higher upward mobility tend to move to urban cities as adults; however, it is not clear from the maps whether the adults from North Carolina continue to reside in the state. However, the Economic Mobility of the States (2012) report by the Pew Center on the States examined the effect of geographic mobility in its report and found the incidence of individuals moving had a positive effect on individuals (those who moved out of their birth states reaped higher incomes than those who remain) and a null effect on each state’s overall income mobility rate. The report also affirmed that, overall, North Carolinians experience less economic mobility than their national peers.
Implications for Community Economic Development
It is no coincidence that some Native American reservations and regions with high concentrations of African-Americans also correspond with places where the odds of moving out of poverty are particularly steep. Research led by the Urban Institute and others have documented the growing disparity between what whites earn relative to blacks and Hispanics. This gap is even bigger when wealth (i.e. total assets minus total liabilities, a significant driver intergenerational mobility) is taken into account, as the white families in North Carolina have more than seven times the wealth of black households. Given that more than half of the state’s residents live in asset poverty, according to CFED’s 2014 Assets & Opportunity Scorecard, there are many avenues from which to enhance the economic mobility outcomes of residents so that disadvantaged children and families are more likely to thrive relative to their peers nationally.
Conclusion
Place-based interventions represent a strategic approach to dealing with the unique, spatial conditions that can undermine an individual’s attempts to attain the American Dream. Professor Chetty’s research indicates that the influence of geography and local opportunity structures (such as schools, personal networks, and the availability of community assets) offer as much (if not more) insight into a child’s economic trajectory than individual-level characteristics. For example, Professor Chetty’s keynote mentioned that white children in majority-black neighborhoods experience reduced odds of achieving upward income mobility similar to their peers in the community. Legacy outcomes related to residential racial segregation patterns are often overlooked when crafting local economic development strategies but, as the data suggests, unpacking racial and income segregation patterns may be a first step to engaging in community transformation, and, thus, increasing economic mobility rates in the state. The Z. Smith Reynolds Foundation is exploring this approach through its Community Economic Development portfolio. Are there other examples of poverty alleviation strategies in the state that explicitly address structural racism as a problem and a means to crafting solutions?
Meisha McDaniel is a dual degree Master’s candidate in the Department of City and Regional Planning and the Kenan-Flagler Business School at UNC-Chapel Hill. She is also a Community Revitalization Fellow with the Development Finance Initiative.
Author(s)
Tagged Under
This blog post is published and posted online by the School of Government to address issues of interest to government officials. This blog post is for educational and informational Copyright ©️ 2009 to present School of Government at the University of North Carolina. All rights reserved. use and may be used for those purposes without permission by providing acknowledgment of its source. Use of this blog post for commercial purposes is prohibited. To browse a complete catalog of School of Government publications, please visit the School’s website at www.sog.unc.edu or contact the Bookstore, School of Government, CB# 3330 Knapp-Sanders Building, UNC Chapel Hill, Chapel Hill, NC 27599-3330; e-mail sales@sog.unc.edu; telephone 919.966.4119; or fax 919.962.2707.