
|
|
|
Community and Economic Development – Blog by UNC School of Government https://ced.sog.unc.edu The Story of Job Growth in North Carolina: Feast or Famine?By Maureen BernerPublished July 20, 2021It is often hard to make sense of monthly statistics on job growth. Year-over-year changes are dramatically impacted by The Federal Reserve Bank of Richmond publishes an economic snapshot of the North Carolina economy each month, tracking data year-over-year. The detailed breakdowns are helpful as a snapshot but limited for longer-term understanding. The July edition highlights that every industry gained jobs over the past year. The one exception was government, which shed more than 3,000. This picture of wide-spread job growth can be misleading, however, given the unusual year we’ve had. The Federal Reserve Bank of Atlanta offers an alternative. It has released updated state-by-state data on a fascinating tool called the Jobs Calculator. Essentially, the Jobs Calculator allows users to identify a target unemployment rate and adopt several economic assumptions, such as labor force growth. It then produces an estimate of the number of jobs North Carolina needs to create in order to hit the target unemployment rate based on 40-year trends. An image of the pattern, below, shows the current dip, and now growth, in the context of three other recessionary periods from 1980 on.
|
Published July 20, 2021 By Maureen Berner
It is often hard to make sense of monthly statistics on job growth. Year-over-year changes are dramatically impacted by COVID-19. With COVID cases rising again, the impact of COVID on tracking job growth or loss, industries affected, and predictions for the future is likely to continue. Fortunately, a newly updated resource allows us to understand our current circumstances in the context of a 40-year trend. The main take-away is that while the causes are different (pandemic-induced downturn versus the sub-prime mortgage-induced economic downturn), the pattern is the same. North Carolina’s experience with job growth or loss is feast or famine.
The Federal Reserve Bank of Richmond publishes an economic snapshot of the North Carolina economy each month, tracking data year-over-year. The detailed breakdowns are helpful as a snapshot but limited for longer-term understanding. The July edition highlights that every industry gained jobs over the past year. The one exception was government, which shed more than 3,000. This picture of wide-spread job growth can be misleading, however, given the unusual year we’ve had.
The Federal Reserve Bank of Atlanta offers an alternative. It has released updated state-by-state data on a fascinating tool called the Jobs Calculator. Essentially, the Jobs Calculator allows users to identify a target unemployment rate and adopt several economic assumptions, such as labor force growth. It then produces an estimate of the number of jobs North Carolina needs to create in order to hit the target unemployment rate based on 40-year trends. An image of the pattern, below, shows the current dip, and now growth, in the context of three other recessionary periods from 1980 on.
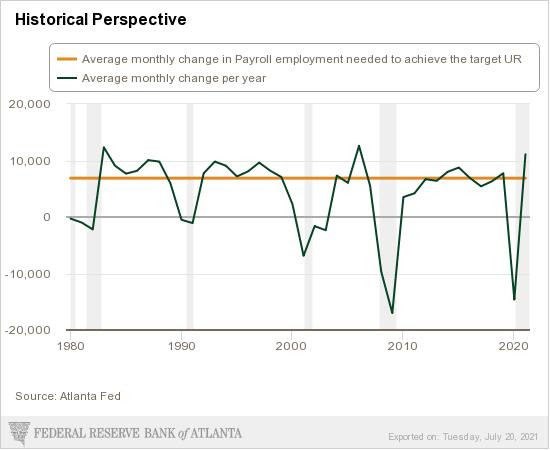 You can see how the North Carolinian economy has sprung back strongly and quickly from the prior recessions. The times in-between the peaks are relatively uneventful by comparison, with slow change. This chart provides hope that the current crisis should be short lived. We are already adding more jobs than in the wake of the 2008 crisis – feasting, so to speak. But when will the next famine hit? I encourage you to explore the data in this tool, especially in estimating how many jobs would have to be created to reach a particular level of unemployment. The key question then, is, what kind of jobs, and how do they contribute to, or take away from, a feast or famine jobs cycle?
Author(s)
Tagged Under
This blog post is published and posted online by the School of Government to address issues of interest to government officials. This blog post is for educational and informational Copyright ©️ 2009 to present School of Government at the University of North Carolina. All rights reserved. use and may be used for those purposes without permission by providing acknowledgment of its source. Use of this blog post for commercial purposes is prohibited. To browse a complete catalog of School of Government publications, please visit the School’s website at www.sog.unc.edu or contact the Bookstore, School of Government, CB# 3330 Knapp-Sanders Building, UNC Chapel Hill, Chapel Hill, NC 27599-3330; e-mail sales@sog.unc.edu; telephone 919.966.4119; or fax 919.962.2707.