
|
|
|
Community and Economic Development – Blog by UNC School of Government https://ced.sog.unc.edu Student Corner: Where are people considering moving to and from?By CED Program Interns & StudentsPublished October 4, 2018
Long touted for its relatively low cost of housing, a strong economy, and temperate climate, North Carolina has seen strong growth for several decades. From 2000 to 2016 North Carolina ranked eighth in the nation for population percentage growth adding 1.9 million residents in that sixteen-year period. Based on 2016 American Community Survey (ACS 5-Year) Data, an estimated 84% of North Carolinians have lived in their house for a year or more, which tracks with the national average of 85%. 12% of NC residents have moved within the state which is also in line with national averages. The data indicates that only 3% of the out-of-state migration happening in the US is attributable to North Carolina. Other southern states including Florida (6%), Georgia (3%) and Virginia (4%) track comparable outmigration. North Carolina’s out-migration is counter balanced by its 3% annual in-migration rate. NC is gaining the most residents from Virginia (36,000), Florida (32,000), South Carolina (32,000), Georgia (25,000), and California (17,000). Redfin recently published a webtool which sorts user search data by the United States’ 80 largest metro markets showing where users are searching. The tool indicates that 72% of searches in Raleigh are completed by residents already in the Raleigh area, with the highest volume of out-of-state searches coming from New York City (24%), Washington, DC (15%) and the Bay Area (8%). For Greensboro, 63% of searches come from within its own metro with New York City (22%), Raleigh (13%) and Washington, DC (11%) compiling the rest of the notable search volume. When analyzing where Redfin users who live in Raleigh are considering when searching for homes, 86% of searches are within the Raleigh metro with the Washington, DC metro representing the only other metro above 10%. Recognizing that larger markets represent an outsized user base which this sample is drawing from, the search data may be skewed towards large metros. Regardless, Redfin’s new tool is an interesting and fun tool to see where residents are considering for their next home.
Another new Redfin data visualization tool is their “Compete Score” index which uses a variety of metrics to measure an area’s housing market competitiveness. High scores indicate markets that see sales with multiple offers, short time on market, and waived contingencies for winning bids. The tool tracks market competitiveness down to the neighborhood scale nationwide. The tool is marketed to help homebuyers understand how aggressively to respond to a listing, but may be a good indicator of wider trends in the housing market. Redfin has stated that they will be issuing this report on an ongoing basis allowing for time-series analysis of housing market competitiveness. In the southern region the most competitive cities include Richmond, VA, Washington D.C., – and with the highest Compete Score in North Carolina – Durham. Durham’s list-to-sale ratio is 100.5% and almost half of Durham’s homes sold above list price.
Publicly compiled data gathered through surveys such as the American Community Survey represent a valuable tool for economic development professionals interested in understanding migration trends within their market of interest. But with the growing number of private companies tracking and publishing their user data, analysts now have an even more robust pool of information to study and track community change. Bobby Funk is a Master’s candidate at UNC-Chapel Hill’s Department of City and Regional Planning and a Community Revitalization Fellow with the Development Finance Initiative.
|
Published October 4, 2018 By CED Program Interns & Students
 One important economic development metric practitioners study is interstate residential migration. While there are several indicators practitioners used to project national migration trends this post will focus on two tools that look at migration patterns for residents across the United States. Understanding where residents are moving and why is an important element in attracting new residents to North Carolina. This post will compare federal survey data with new tools produced by Redfin to see where migration patterns are currently trending, and where homebuyers are considering for relocation.
Long touted for its relatively low cost of housing, a strong economy, and temperate climate, North Carolina has seen strong growth for several decades. From 2000 to 2016 North Carolina ranked eighth in the nation for population percentage growth adding 1.9 million residents in that sixteen-year period.
Based on 2016 American Community Survey (ACS 5-Year) Data, an estimated 84% of North Carolinians have lived in their house for a year or more, which tracks with the national average of 85%. 12% of NC residents have moved within the state which is also in line with national averages. The data indicates that only 3% of the out-of-state migration happening in the US is attributable to North Carolina. Other southern states including Florida (6%), Georgia (3%) and Virginia (4%) track comparable outmigration. North Carolina’s out-migration is counter balanced by its 3% annual in-migration rate. NC is gaining the most residents from Virginia (36,000), Florida (32,000), South Carolina (32,000), Georgia (25,000), and California (17,000).
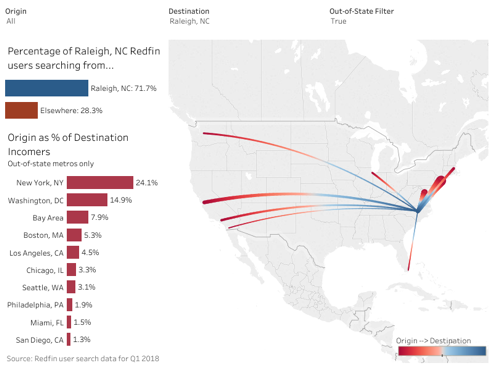
Redfin recently published a webtool which sorts user search data by the United States’ 80 largest metro markets showing where users are searching. The tool indicates that 72% of searches in Raleigh are completed by residents already in the Raleigh area, with the highest volume of out-of-state searches coming from New York City (24%), Washington, DC (15%) and the Bay Area (8%). For Greensboro, 63% of searches come from within its own metro with New York City (22%), Raleigh (13%) and Washington, DC (11%) compiling the rest of the notable search volume. When analyzing where Redfin users who live in Raleigh are considering when searching for homes, 86% of searches are within the Raleigh metro with the Washington, DC metro representing the only other metro above 10%. Recognizing that larger markets represent an outsized user base which this sample is drawing from, the search data may be skewed towards large metros. Regardless, Redfin’s new tool is an interesting and fun tool to see where residents are considering for their next home.
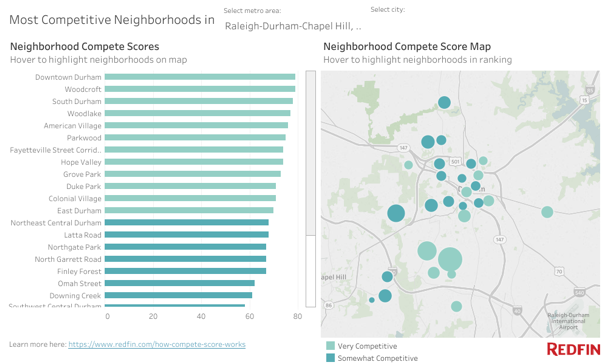
Another new Redfin data visualization tool is their “Compete Score” index which uses a variety of metrics to measure an area’s housing market competitiveness. High scores indicate markets that see sales with multiple offers, short time on market, and waived contingencies for winning bids. The tool tracks market competitiveness down to the neighborhood scale nationwide. The tool is marketed to help homebuyers understand how aggressively to respond to a listing, but may be a good indicator of wider trends in the housing market. Redfin has stated that they will be issuing this report on an ongoing basis allowing for time-series analysis of housing market competitiveness. In the southern region the most competitive cities include Richmond, VA, Washington D.C., – and with the highest Compete Score in North Carolina – Durham. Durham’s list-to-sale ratio is 100.5% and almost half of Durham’s homes sold above list price.
Publicly compiled data gathered through surveys such as the American Community Survey represent a valuable tool for economic development professionals interested in understanding migration trends within their market of interest. But with the growing number of private companies tracking and publishing their user data, analysts now have an even more robust pool of information to study and track community change.
Bobby Funk is a Master’s candidate at UNC-Chapel Hill’s Department of City and Regional Planning and a Community Revitalization Fellow with the Development Finance Initiative.
Author(s)
Tagged Under
This blog post is published and posted online by the School of Government to address issues of interest to government officials. This blog post is for educational and informational Copyright ©️ 2009 to present School of Government at the University of North Carolina. All rights reserved. use and may be used for those purposes without permission by providing acknowledgment of its source. Use of this blog post for commercial purposes is prohibited. To browse a complete catalog of School of Government publications, please visit the School’s website at www.sog.unc.edu or contact the Bookstore, School of Government, CB# 3330 Knapp-Sanders Building, UNC Chapel Hill, Chapel Hill, NC 27599-3330; e-mail sales@sog.unc.edu; telephone 919.966.4119; or fax 919.962.2707.