In previous posts, we have discussed where to find data to help make smart financial and managerial decisions. Another vital data source for any enterprise is its own financial statements, from which enterprises can calculate key financial indicators.
Let’s look at key financial indicators from the perspective of a business-like unit within government–a water or wastewater system. Key financial indicators are a way for that enterprise to get a snapshot of its financial health and to determine whether it needs to make adjustments to its rates, and they should be calculated annually when financial statements are released. One important financial indicator is operating ratio, which measures the ratio of annual operating revenues to annual operating expenses. To be a true enterprise fund that is self-supporting, a system should strive to have at least as much operating revenue as it has operating expenses, if not more. Otherwise, the system would be operating at a loss.
Operating revenue includes any money the system receives for its services, including income from rates, tap/connection fees, penalties, and other sources. Operating expenses include items such as salary, benefits and employee taxes for staff, supplies, treatment chemicals, filters, utilities, insurance, lab and testing fees, minor repairs and regular maintenance, and, if applicable, the cost of purchasing water from another system. These are the costs of running the system day in and day out. If the system is owned by a government that follows GASB 34 procedures for audited financial statements, these numbers can be found on the Statement of Revenues, Expenses, and Changes in Fund Net Assets for the proprietary fund.
You can calculate the operating ratio using these revenues and expenses to see whether the system is covering its everyday expenses, but a better calculation would also include depreciation as an expense. Depreciation is a rough estimate of how much useful life the system’s capital assets have used up (remember, this is measured by accountants using formulas and not by your system’s engineers). By including depreciation in your operating ratio calculation, you can begin to see whether your system is charging customers enough to cover the replacement of current assets along with your daily operating costs.
In our workshops on rate setting and fiscal planning for small water systems, we often include a session on how to measure key financial indicators like operating ratio by showing two example water systems—Bavaria and Mayberry. These are two similarly sized water systems from the same state (the names have been changed, but the numbers are real). Each serves about 1,500 customers, and each community has a median household income of about $30,000 with about 25 percent of residents living below the poverty line. On paper, these two systems look identical, but their operating ratios tell a very different story.
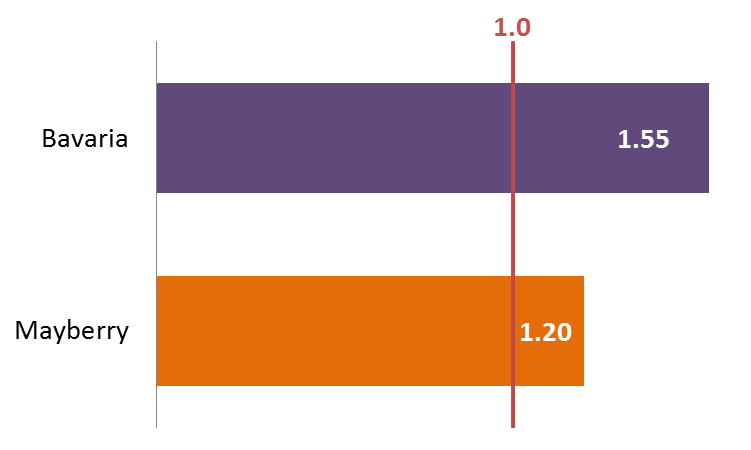
In our example, Bavaria has annual operating revenues of about $710,000, with expenses (excluding depreciation) of about $460,000, which gives it a ratio greater than 1.5. That means when Bavaria pays all of its operating expenses, it has half again that total to spend on other items such as debt service and the future cost of capital.
In Mayberry, the annual operating revenue is about $444,000, with annual operating expenses (without depreciation) of approximately $369,000. Thus, Mayberry’s operating ratio is 1.2, which is less than the ratio in Bavaria but still a good bit above the break-even point.

- Operating Ratio without Depreciation
However, when depreciation is included in the equation, the numbers for both systems change dramatically. Bavaria’s annual deprecation is just over $212,000, so when it is added to other operating expenses, the system’s operating ratio drops to 1.06, just above breakeven. The situation in Mayberry is even worse. Its annual depreciation cost is over $142,000, so adding it to other operating expenses drops Mayberry’s operating ratio to 0.87. That means that Mayberry is not bringing in enough annual revenue to set aside for future capital needs once it pays off all of its bills.
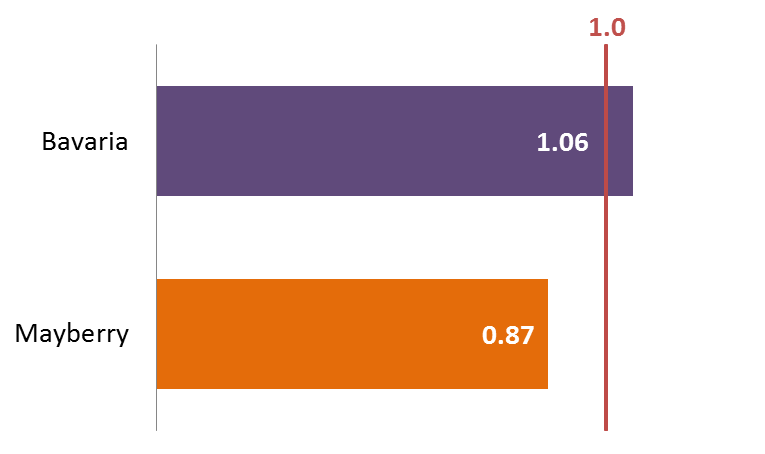
- Operating Ratio including Depreciation
By calculating operating ratio without depreciation, both of these systems may feel secure in their annual revenues, but including depreciation in the calculation may prompt both systems to consider rate increases. The natural benchmark for operating ratio is 1.0, or break-even, but often a higher number is desired. Several of the Environmental Finance Center’s rates dashboards include operating ratio, and we suggest that systems may wish for an operating ratio of 1.2 with depreciation and 1.5 without depreciation to have enough funds to cover daily expenses, debt service, capital replacement costs, emergencies, and unexpected revenue shortfalls. Calculating this and other ratios can be the first step in an annual review of the adequacy of water and wastewater rates.